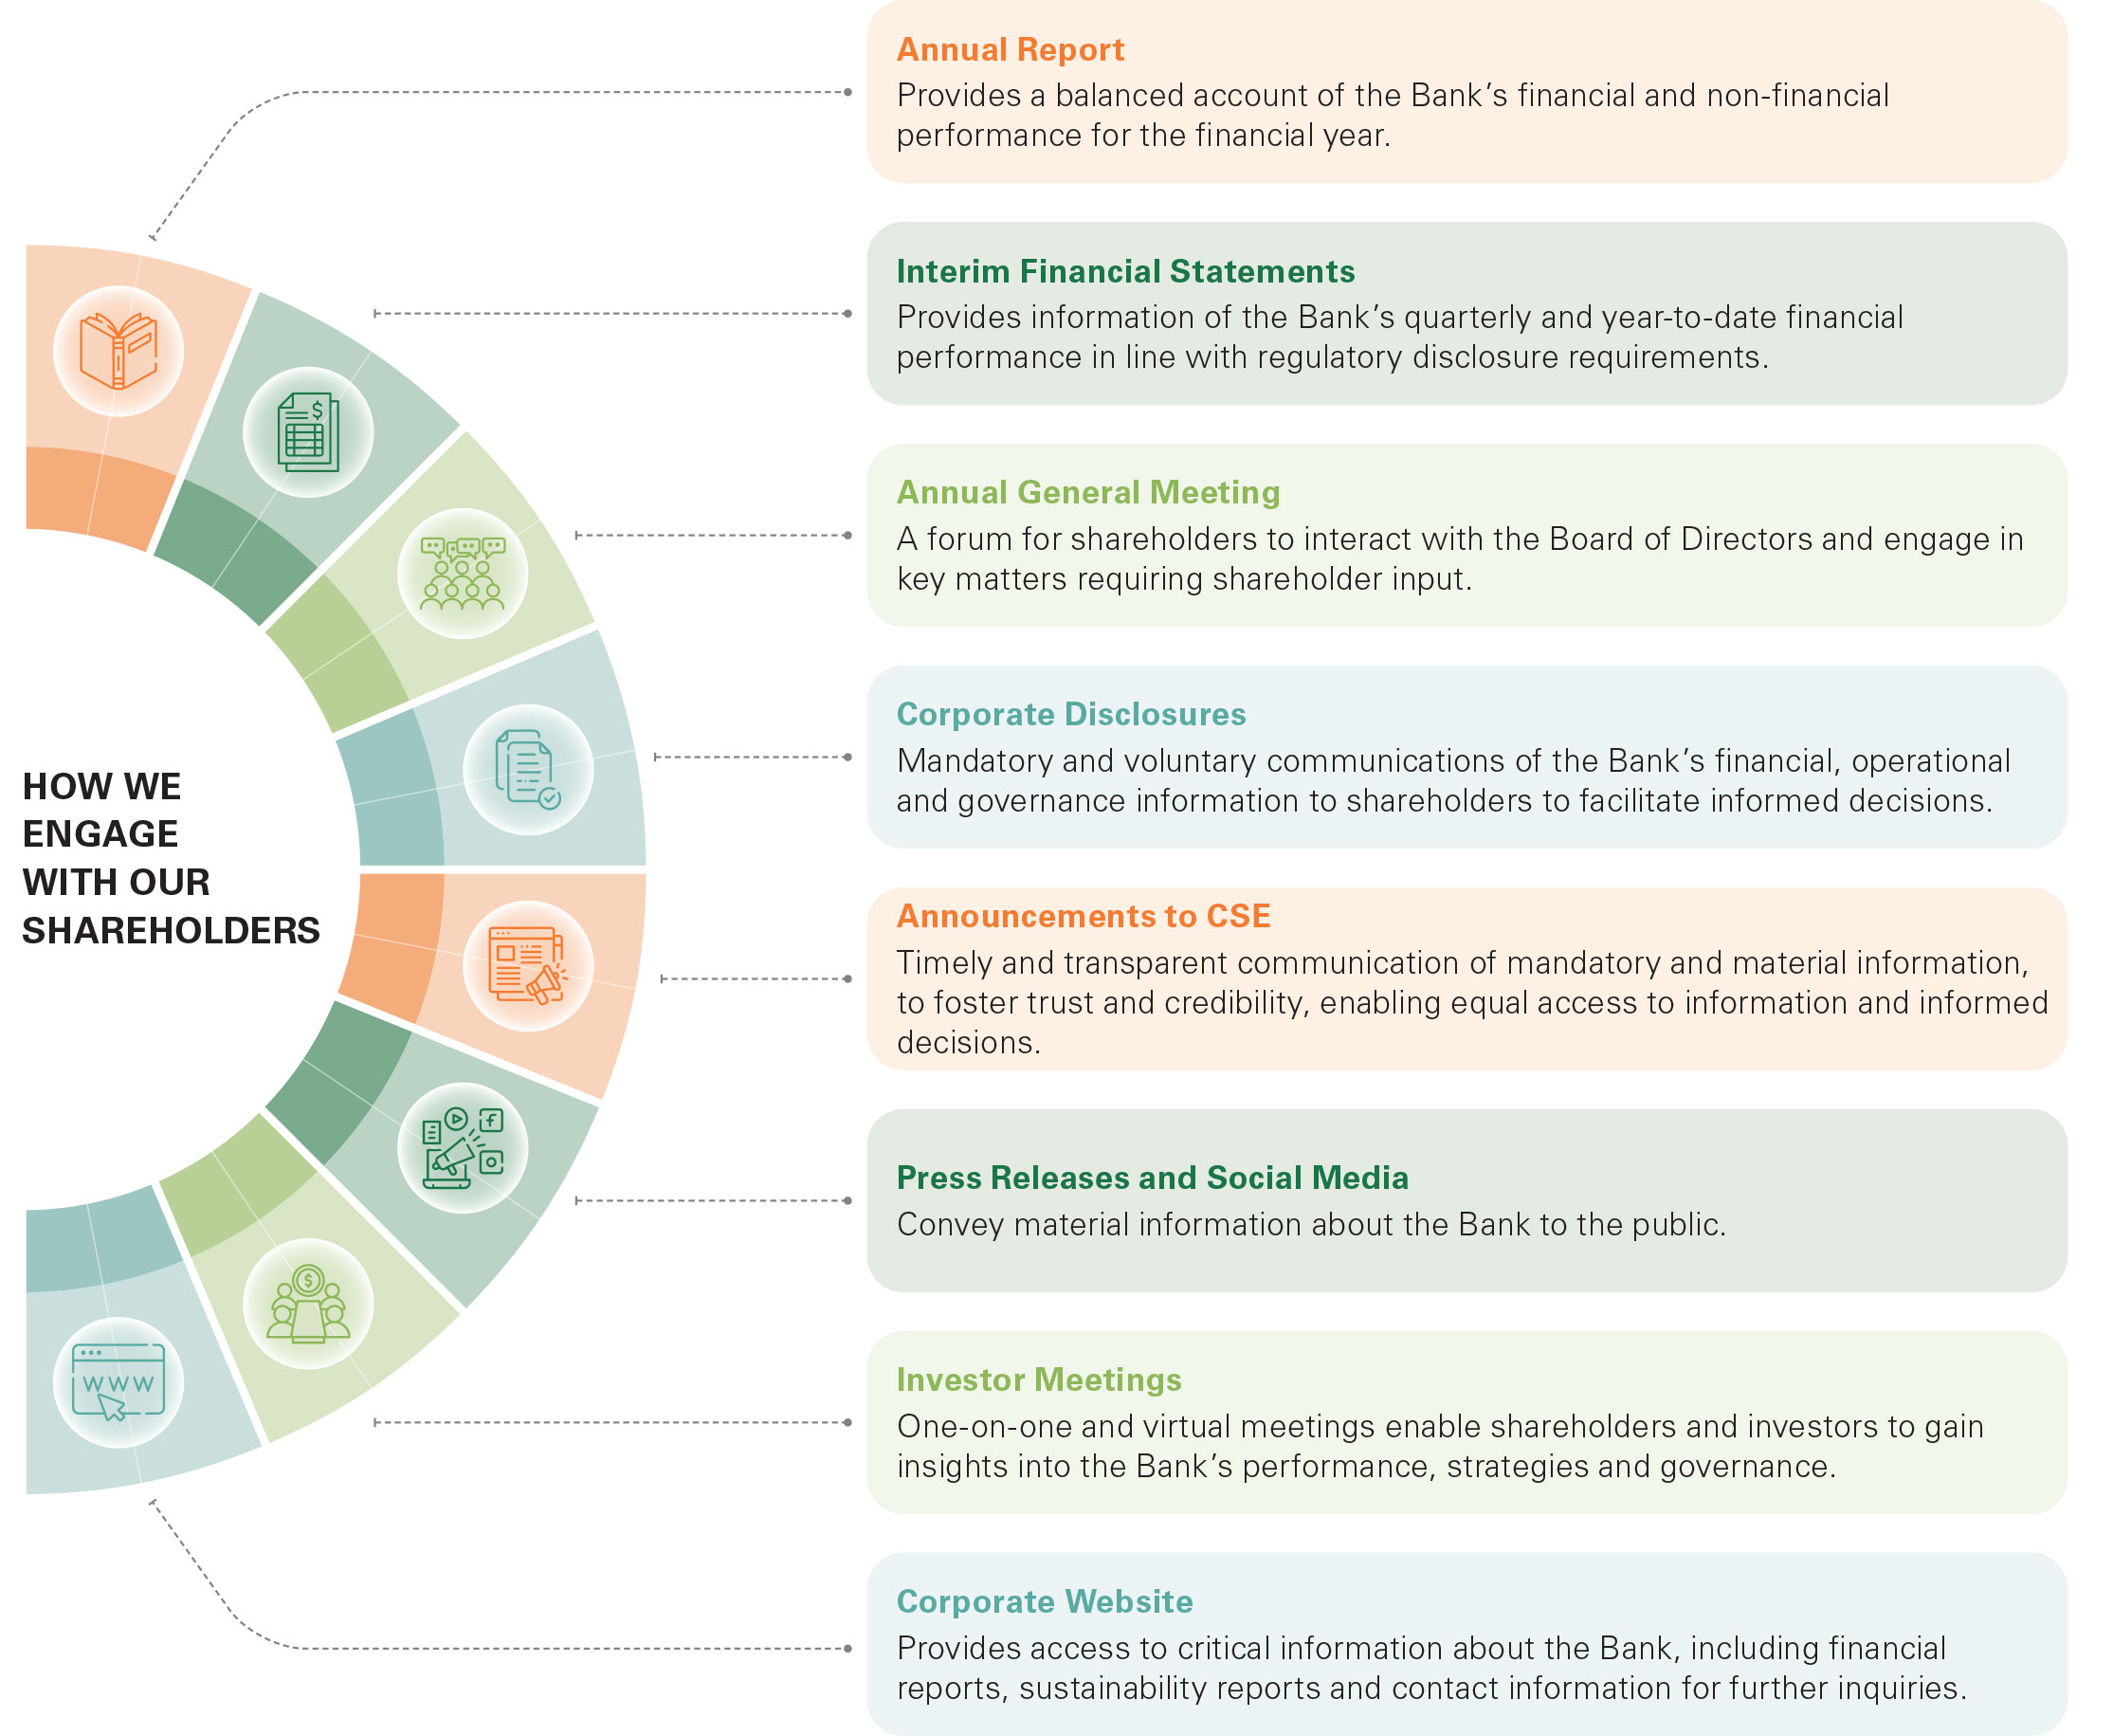
Investor Relations
Engaging effectively with shareholders and investors is a key priority at Sampath Bank. To this end, the Bank has established a Board Sub-Committee – the ‘Board Shareholder Relations Committee’ – to ensure shareholders’ concerns are identified and effectively incorporated into the Bank’s strategy. Sampath Bank is likely the only institution listed on the Colombo Stock Exchange to have established a Board Sub-Committee dedicated to shareholder relations, underscoring the importance of shareholder engagement to the Bank. Members of the Board Sub-Committee meet with shareholders annually to discuss
and address areas of concern. Building on this, the Bank established its ‘Policy on Relations with Shareholders and Investors’ in October 2024, to facilitate a formal and structured approach to shareholder/ investor engagement. Moreover, the Bank recognises the importance of ensuring that shareholders have equal and timely access to material information about the Bank, enabling them to exercise their rights effectively. As specified in the new policy, the three principles below, form the foundation for effective shareholder engagement at Sampath Bank,
- Comply with all regulatory requirements applicable to licensed commercial banks and listed entities in Sri Lanka.
- Ensure open and fair disclosures with emphasis on the integrity, timeliness and relevance of the information provided.
- Maintain multiple channels of communication to cater to the needs of diverse shareholders and promote ongoing shareholder engagement.
Key mechanisms for fostering shareholder engagement at Sampath Bank are highlighted below.
VALUE CREATION FOR SHAREHOLDERS
|
2024 |
2023 |
Change |
|
|---|---|---|---|
|
% |
|||
|
Net asset value per share (Rs) |
142.01 |
126.10 |
12.6 |
|
Group earnings per share - Basic (Rs) |
24.48 |
15.28 |
60.1 |
|
Dividend per share (Rs) |
9.35 |
5.85 |
59.8 |
|
Market price per share as at 31st December (Rs) |
118.25 |
70.50 |
67.7 |
|
Dividend payout ratio (%) |
40.13 |
40.02 |
0.3 |


* The highest market price in 2021 is not adjusted for the sub-division of shares in 2021.
** The earnings per share and the net asset value per share of the Bank and the Group for the year 2021 and 2022 have been adjusted to reflect the increased number of shares due to the scrip dividend declared for 2022.
BANK'S MARKET CAPITALISATION IN COMPARISON TO CSE - AS AT 31ST DECEMBER
|
2024 |
2023 |
2022 |
2021 |
2020 |
2019 |
|
|---|---|---|---|---|---|---|
|
Sampath Bank's market capitalisation (Rs Mn) |
138,672 |
82,675 |
39,138 |
59,622 |
51,726 |
61,949 |
|
Increase/(Decrease) % in market capitalisation |
68% |
111% |
(34%) |
15% |
(17%) |
(6%) |
|
CSE market capitalisation (Rs Mn) |
5,695,560 |
4,248,935 |
3,847,153 |
5,489,168 |
2,960,648 |
2,851,313 |
|
As a % of CSE market capitalisation |
2.43% |
1.95% |
1.02% |
1.09% |
1.75% |
2.17% |
|
Market capitalisation rank |
9 |
12 |
23 |
21 |
17 |
10 |


ANALYSIS OF SHAREHOLDERS
Resident/Non-Resident
| 31st December 2024 | 31st December 2023 | |||||
|---|---|---|---|---|---|---|
| No. of Shareholders | No. of Shares | % | No. of Shareholders | No. of Shares | % | |
| Resident shareholders | 30,443 | 1,109,110,222 | 94.58 | 28,946 | 1,101,150,554 | 93.90 |
| Non-resident shareholders | 234 | 63,590,538 | 5.42 | 227 | 71,550,206 | 6.10 |
| Total | 30,677 | 1,172,700,760 | 100.00 | 29,173 | 1,172,700,760 | 100.00 |
Individuals/Institutions
| 31st December 2024 | 31st December 2023 | |||||
|---|---|---|---|---|---|---|
| No. of Shareholders | No. of Shares | % | No. of Shareholders | No. of Shares | % | |
| Individuals | 29,767 | 386,316,126 | 32.94 | 28,342 | 350,026,626 | 29.85 |
| Institutions | 910 | 786,384,634 | 67.06 | 831 | 822,674,134 | 70.15 |
| Total | 30,677 | 1,172,700,760 | 100.00 | 29,173 | 1,172,700,760 | 100.00 |
Composition of Share Ownership
| 31st December 2024 | 31st December 2023 | |||||||
|---|---|---|---|---|---|---|---|---|
| No. of Shareholders | % | No. of Shares | % | No. of Shareholders | % | No. of Shares | % | |
| 1 - 1,000 shares | 14,937 | 48.69 | 4,080,736 | 0.35 | 13,748 | 47.13 | 3,740,618 | 0.32 |
| 1,001 - 10,000 shares | 11,683 | 38.08 | 37,120,758 | 3.16 | 11,527 | 39.51 | 36,158,197 | 3.08 |
| 10,001 - 100,000 shares | 3,513 | 11.45 | 96,963,214 | 8.27 | 3,400 | 11.65 | 91,365,964 | 7.79 |
| 100,001 - 1,000,000 shares | 456 | 1.49 | 120,804,488 | 10.30 | 429 | 1.47 | 111,879,047 | 9.54 |
| Over 1,000,000 shares | 88 | 0.29 | 913,731,564 | 77.92 | 69 | 0.24 | 929,556,934 | 79.27 |
| Total | 30,677 | 100.00 | 1,172,700,760 | 100.00 | 29,173 | 100.00 | 1,172,700,760 | 100.00 |


SHARE TRADING
Market
| 2024 | 2023 | 2022 | 2021 | 2020 | |
|---|---|---|---|---|---|
| No. of transactions | 3,524,067 | 3,618,960 | 6,057,233 | 8,131,508 | 3,070,021 |
| No. of shares traded | 23,249,694,068 | 16,988,827,390 | 29,047,818,242 | 59,771,688,538 | 21,348,728,655 |
| Value of shares traded (Rs Mn) | 537,635 | 410,629 | 686,602 | 1,173,157 | 396,882 |
Bank
| 2024 | 2023 | 2022 | 2021 | 2020 | |
|---|---|---|---|---|---|
| No. of transactions | 94,048 | 90,860 | 57,981 | 159,003 | 89,358 |
| No. of shares traded | 385,841,958 | 308,275,126 | 116,309,634 | 332,368,388 | 120,322,546 |
| As a % of total shares in issue | 32.90 | 26.29 | 10.16 | 29.04 | 31.54 |
| Average daily turnover (Rs Mn) | 575.40 | 75.36 | 20.66 | 110.31 | 73.79 |
| Value of shares traded (Rs Mn) | 32,625.84 | 18,312.82 | 4,812.84 | 26,144.44 | 15,423.04 |
Sampath Bank's Share Price Fluctuation
| 2024 | 2023 | 2022 | 2021 | 2020 | |
|---|---|---|---|---|---|
| Lowest market price (Rs) | 66.00 | 33.00 | 26.00 | 48.00 | 96.00 |
| Highest market price (Rs) | 119.00 | 79.20 | 56.50 | 250.00* | 170.00 |
| Closing price as at 31st December (Rs) | 118.25 | 70.50 | 34.20 | 52.10 | 135.60 |
* Highest share price of Rs 250.00 reported prior to the sub-division of shares in 2021.


SAMPATH BANK PLC - ORDINARY SHARES
Frequency Distribution of Shareholders as at 31st December 2024
|
Share Range |
Resident |
Non-Resident |
Total |
|||||||||
|---|---|---|---|---|---|---|---|---|---|---|---|---|
|
No. of Shareholders |
% |
No. of Shares |
% |
No. of Shareholders |
% |
No. of Shares |
% |
No. of Shareholders |
% |
No. of Shares |
% |
|
|
1 - 250 |
9,275 |
30.23 |
713,947 |
0.06 |
26 |
0.08 |
1,936 |
0.00 |
9,301 |
30.32 |
715,883 |
0.06 |
|
251 - 500 |
2,580 |
8.41 |
967,225 |
0.08 |
13 |
0.04 |
5,174 |
0.00 |
2,593 |
8.45 |
972,399 |
0.08 |
|
501 - 1,000 |
3,028 |
9.87 |
2,379,993 |
0.20 |
15 |
0.05 |
12,461 |
0.00 |
3,043 |
9.92 |
2,392,454 |
0.21 |
|
1,001 - 2,000 |
4,764 |
15.53 |
6,214,428 |
0.53 |
19 |
0.06 |
27,041 |
0.00 |
4,783 |
15.59 |
6,241,469 |
0.53 |
|
2,001 - 5,000 |
4,343 |
14.16 |
13,305,611 |
1.13 |
26 |
0.08 |
80,170 |
0.01 |
4,369 |
14.24 |
13,385,781 |
1.14 |
|
5,001 - 10,000 |
2,498 |
8.14 |
17,245,690 |
1.47 |
33 |
0.11 |
247,818 |
0.02 |
2,531 |
8.25 |
17,493,508 |
1.49 |
|
10,001 - 20,000 |
1,780 |
5.80 |
24,446,850 |
2.08 |
33 |
0.11 |
472,709 |
0.04 |
1,813 |
5.91 |
24,919,559 |
2.13 |
|
20,001 - 30,000 |
626 |
2.04 |
15,240,835 |
1.30 |
16 |
0.05 |
368,239 |
0.03 |
642 |
2.09 |
15,609,074 |
1.33 |
|
30,001 - 40,000 |
344 |
1.12 |
11,891,799 |
1.01 |
6 |
0.02 |
219,405 |
0.02 |
350 |
1.14 |
12,111,204 |
1.03 |
|
40,001 - 50,000 |
224 |
0.73 |
10,240,925 |
0.87 |
5 |
0.02 |
229,210 |
0.02 |
229 |
0.75 |
10,470,135 |
0.89 |
|
50,001 - 100,000 |
467 |
1.52 |
32,932,800 |
2.81 |
12 |
0.04 |
920,442 |
0.08 |
479 |
1.56 |
33,853,242 |
2.89 |
|
100,001 - 1,000,000 |
437 |
1.42 |
114,237,008 |
9.74 |
19 |
0.06 |
6,567,480 |
0.56 |
456 |
1.49 |
120,804,488 |
10.30 |
|
Over 1,000,000 |
77 |
0.25 |
859,293,111 |
73.27 |
11 |
0.04 |
54,438,453 |
4.64 |
88 |
0.29 |
913,731,564 |
77.92 |
|
Total |
30,443 |
99.24 |
1,109,110,222 |
94.58 |
234 |
0.76 |
63,590,538 |
5.42 |
30,677 |
100.00 |
1,172,700,760 |
100.00 |
SAMPATH BANK PLC - ORDINARY SHARES
Top 20 Shareholders
|
No. |
Name of the Shareholder |
31st December 2024 |
31st December 2023* |
||
|---|---|---|---|---|---|
|
No. of Shares |
% Holding |
No. of Shares |
% Holding |
||
|
1 |
VALLIBEL ONE PLC |
175,352,762 |
14.95 |
175,352,762 |
14.95 |
|
2 |
PHANTOM INVESTMENTS (PVT) LTD |
117,270,076 |
10.00 |
117,270,076 |
10.00 |
|
3 |
MR Y S H I SILVA |
117,000,065 |
9.98 |
96,121,110 |
8.20 |
|
4 |
EMPLOYEES' PROVIDENT FUND |
116,948,697 |
9.97 |
116,948,697 |
9.97 |
|
5 |
ROSEWOOD (PVT) LIMITED |
55,270,454 |
4.71 |
52,830,454 |
4.51 |
|
6 |
AYENKA HOLDINGS PRIVATE LIMITED |
42,100,476 |
3.59 |
116,948,834 |
9.97 |
|
7 |
AKBAR BROTHERS PVT LTD A/C NO 1 |
36,898,792 |
3.15 |
28,134,771 |
2.40 |
|
8 |
MR W JINADASA |
18,348,658 |
1.56 |
9,201,828 |
0.78 |
|
9 |
MRS P D A S BERUWALAGE |
12,012,417 |
1.02 |
11,555,469 |
0.99 |
|
10 |
SAMPATH BANK PLC ACCOUNT NO 04 (SAMPATH BANK PENSION FUND) |
11,832,461 |
1.01 |
11,832,461 |
1.01 |
|
11 |
ANDARADENIYA ESTATE (PVT) LTD |
11,109,352 |
0.95 |
2,421,144 |
0.21 |
|
12 |
FIRST CAPITAL HOLDINGS PLC |
10,100,000 |
0.86 |
- |
- |
|
13 |
BBH-TUNDRA SUSTAINABLE FRONTIER FUND |
9,837,629 |
0.84 |
9,837,629 |
0.84 |
|
14 |
SSBT-AL MEHWAR COMMERCIAL INVESTMENTS L.L.C. |
9,725,281 |
0.83 |
6,877,041 |
0.59 |
|
15 |
ARRC CAPITAL (PVT) LTD |
8,738,312 |
0.75 |
256,375 |
0.02 |
|
16 |
BBH -TUNDRA SHIKARI GLOBAL |
8,440,000 |
0.72 |
- |
- |
|
17 |
RANAVAV HOLDINGS (PVT) LTD |
7,935,000 |
0.68 |
- |
- |
|
18 |
EMPLOYEES' TRUST FUND BOARD |
7,633,883 |
0.65 |
19,959,469 |
1.70 |
|
19 |
JANASHAKTHI INSURANCE PLC- SHAREHOLDERS |
7,500,000 |
0.64 |
- |
- |
|
20 |
MAGNA WEALTH (PVT) LTD |
6,936,815 |
0.59 |
6,361,683 |
0.54 |
|
790,991,130 |
67.45 |
781,909,803 |
66.68 |
||
|
Total No. of shares registered |
1,172,700,760 |
100.00 |
1,172,700,760 |
100.00 |
|
|
Total No. of shares unregistered |
- |
- |
- |
- |
|
|
Total No. of shares issued |
1,172,700,760 |
100.00 |
1,172,700,760 |
100.00 |
|
|
Shares held by Directors |
675,639 |
0.06 |
328,893 |
0.03 |
|
|
Shares held by Institutions |
786,384,634 |
67.06 |
822,674,134 |
70.15 |
|
|
Balance held by Others |
385,640,487 |
32.88 |
349,697,733 |
29.82 |
|
|
Total No. of shares issued |
1,172,700,760 |
100.00 |
1,172,700,760 |
100.00 |
|
|
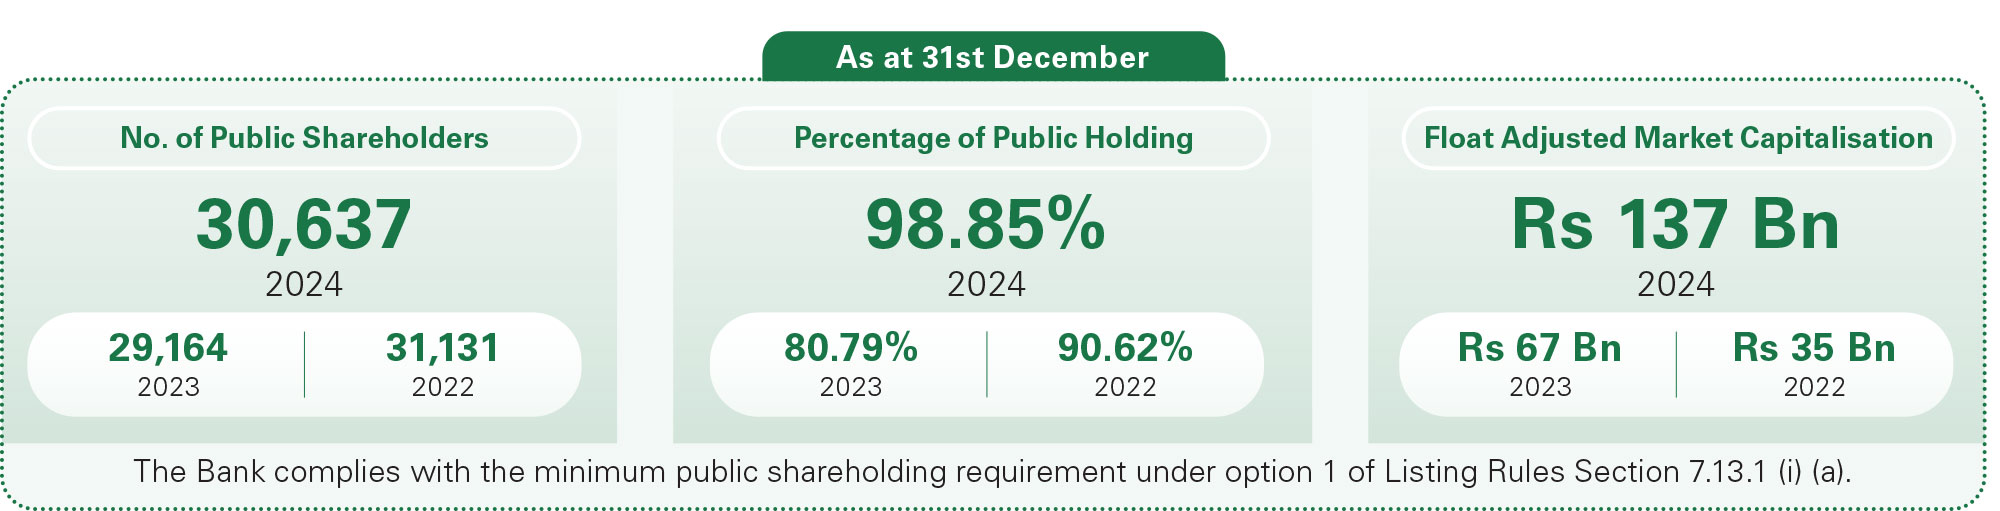
No. of Public Shareholders |
30,637 |
29,164 |
|||
|
% Shares held by Public |
98.85 |
80.79 |
|||
|
% Shares held by Directors and Related Parties |
1.15 |
19.21 |
|||
* Shareholding as at 31st December 2023 of the top twenty shareholders as at 31st December 2024.

SUBSIDIARIES - ORDINARY SHARES
|
Sampath Centre Limited |
SC Securities (Pvt) Limited |
Siyapatha |
Sampath Information Technology Solutions Limited |
|||||
|---|---|---|---|---|---|---|---|---|
|
No. of Shares |
Stated Capital Rs 000 |
No. of Shares |
Stated Capital Rs 000 |
No. of Shares |
Stated Capital Rs 000 |
No. of Shares |
Stated Capital Rs 000 |
|
|
As at 1st January 2023 |
36,311,748 |
516,481 |
12,090,372 |
144,635 |
97,166,011 |
2,674,439 |
10,609,937 |
314,237 |
|
Add: Increase due to scrip dividend |
6,111 |
850 |
89,901 |
4,679 |
3,163,526 |
192,437 |
290,646 |
14,162 |
|
As at 31st December 2023 |
36,317,859 |
517,331 |
12,180,273 |
149,314 |
100,329,537 |
2,866,876 |
10,900,583 |
328,399 |
|
As at 1st January 2024 |
36,317,859 |
517,331 |
12,180,273 |
149,314 |
100,329,537 |
2,866,876 |
10,900,583 |
328,399 |
|
Add: Increase due to scrip dividend |
378,574 |
56,857 |
- |
- |
91,826 |
5,970 |
295,920 |
17,253 |
|
As at 31st December 2024 |
36,696,433 |
574,188 |
12,180,273 |
149,314 |
100,421,363 |
2,872,846 |
11,196,503 |
345,652 |
DIVIDEND PAYMENT DETAILS
| Year | Total Dividend Paid | Dividend per Share* | Cash Dividend per Share* | Scrip Dividend per Share* | Profit for the Year | Dividend Payout Ratio |
|---|---|---|---|---|---|---|
| Rs Mn | Rs | Rs | Rs | Rs Mn | ||
| 1988 | 8.80 | 0.50 | 0.50 | n/a | 27 | 32.59% |
| 1989 | 13.10 | 0.75 | 0.75 | n/a | 20 | 65.50% |
| 1990 | 8.90 | 0.50 | 0.50 | n/a | 10 | 89.00% |
| 1991 | 17.70 | 0.50 | 0.50 | n/a | 41 | 43.17% |
| 1992 | 35.40 | 1.00 | 1.00 | n/a | 71 | 49.86% |
| 1993 | 35.40 | 1.00 | 1.00 | n/a | 122 | 29.02% |
| 1994 | 44.30 | 1.25 | 1.25 | n/a | 172 | 25.76% |
| 1995 | 53.10 | 1.50 | 1.50 | n/a | 241 | 22.03% |
| 1996 | 53.10 | 1.50 | 1.50 | n/a | 282 | 18.83% |
| 1997 | 53.10 | 1.50 | 1.50 | n/a | 322 | 16.49% |
| 1998 | 53.10 | 1.50 | 1.50 | n/a | 372 | 14.27% |
| 1999 (Interim) | 116.90 | 4.00 | 3.30 | n/a | 261 | 54.29% |
| 1999 (Final) | 24.80 | 0.70 | n/a | |||
| 2000 | 58.70 | 1.75 | 1.75 | n/a | 402 | 14.60% |
| 2001 | 52.14 | 1.75 | 1.75 | n/a | 322 | 16.19% |
| 2002 | 88.57 | 2.00 | 2.00 | n/a | 441 | 20.08% |
| 2003 (Interim) | 59.78 | 2.00 | 2.00 | n/a | 561 | 14.58% |
| 2003 (Final) | 21.99 | |||||
| 2004 (Interim) | 65.98 | 2.00 | 2.00 | n/a | 621 | 16.15% |
| 2004 (Final) | 34.30 | |||||
| 2005 (Interim) | 87.14 | 2.00 | 2.00 | n/a | 821 | 14.54% |
| 2005 (Final) | 32.21 | |||||
| 2006 | 155.47 | 2.50 | 2.50 | n/a | 1,028 | 15.12% |
| 2007 | 206.66 | 3.00 | 3.00 | n/a | 1,052 | 19.64% |
| 2008 | 256.65 | 4.00 | 4.00 | n/a | 1,414 | 18.15% |
| 2009 | 436.19 | 6.25 | 6.25 | n/a | 2,098 | 20.79% |
| 2010 | 1,235.86 | 8.09 | n/a | 8.09 | 3,303 | 37.42% |
| 2011 | 1,426.98 | 9.00 | 4.50 | 4.50 | 3,819 | 37.37% |
| 2012 | 1,954.10 | 12.00 | 6.00 | 6.00 | 5,230 | 37.36% |
| 2013 | 1,342.63 | 8.00 | 8.00 | n/a | 3,430 | 39.13% |
| 2014 | 1,847.01 | 11.00 | 5.00 | 6.00 | 4,914 | 37.59% |
| 2015 | 2,240.06 | 13.00 | 6.00 | 7.00 | 6,134 | 36.52% |
| 2016 (Interim) | 2,477.73 | 18.75 | n/a | 14.00 | 9,125 | 36.85% |
| 2016 (Final) | 884.41 | 4.75 | n/a | |||
| 2017 | 4,598.43 | 17.20 | n/a | 17.20 | 12,104 | 38.00% |
| 2018 | 4,564.66 | 16.25 | 5.00 | 11.25 | 12,143 | 37.59% |
| 2019 | 4,482.13 | 11.75 | 11.75 | n/a | 11,151 | 40.19% |
| 2020 | 3,147.03 | 2.75 | 2.75 | n/a | 8,025 | 39.21% |
| 2021 | 4,863.59 | 4.25 | 4.25 | n/a | 12,457 | 39.04% |
| 2022 | 5,264.12 | 4.60 | 3.45 | 1.15 | 13,134 | 40.08% |
| 2023 | 6,860.30 | 5.85 | 5.85 | n/a | 17,140 | 40.02% |
| 2024 (Proposed) | 10,964.75 | 9.35 | 9.35 | n/a | 27,321 | 40.13% |
n/a - not applicable
* Actual dividend per share paid in each year.
RECORD OF SCRIP ISSUES
| Year | Issue | Basis/Proportion | No. of Shares Issued | Consideration per Share | Contribution to Stated Capital | Reason for Issue |
|---|---|---|---|---|---|---|
| Rs | Rs Mn | |||||
| 2010 | Interim Scrip Dividend for 2010 | 1 for 120.74 | 627,596 | 326.00 | 204.6 | Increase stated capital |
| 2011 | Final Scrip Dividend for 2010 | 1 for 43.39 | 3,521,294 | 260.00 | 915.5 | Increase stated capital |
| 2012 | Final Scrip Dividend for 2011 | 1 for 43.06 | 3,682,039 | 175.00 | 644.4 | Increase stated capital |
| 2013 | Final Scrip Dividend for 2012 | 1 for 33.12 | 4,916,007 | 180.10 | 885.4 | Increase stated capital |
| 2015 | Final Scrip Dividend for 2014 | 1 for 38.14 | 4,402,402 | 206.99 | 911.3 | Increase stated capital |
| 2016 | Final Scrip Dividend for 2015 | 1 for 36.91 | 4,668,414 | 233.44 | 1,089.8 | Increase stated capital |
| 2017 | Interim Scrip Dividend for 2016 | 1 for 19.22 | 9,209,419 | 242.55 | 2,233.7 | Increase stated capital |
| 2018 | Final Scrip Dividend for 2017 | 1 for 19.72 | 13,551,804 | 291.93 | 3,956.1 | Increase stated capital |
| 2019 | Final Scrip Dividend for 2018 | 1 for 24.32 | 11,548,874 | 235.66 | 2,721.6 | Increase stated capital |
| 2023 | Final Scrip Dividend for 2022 | 1 for 40.40 | 28,326,805 | 39.49 | 1,118.6 | Increase stated capital |
RECORD OF BONUS ISSUES AND SUB-DIVISIONS
| Year | Issue | Basis/Proportion | No. of Shares Issued | Reason for Issue |
|---|---|---|---|---|
| 2004 | Bonus Issue | 1 for 6 | 7,380,817 | Benefit to shareholders |
| 2010 | Consolidation and Sub-division | 11 for 10 | 6,888,762 | Benefit to shareholders |
| 2010 | Sub-division | 1 for 1 | 76,403,986 | Benefit to shareholders |
| 2021 | Sub-division | 3 for 1 | 762,915,970 | Benefit to shareholders |
RECORD OF RIGHTS ISSUES
| Year | Issue | Basis/Proportion | No. of Shares Issued | Price per Share | Contribution to Stated Capital |
|---|---|---|---|---|---|
| Rs | Rs Mn | ||||
| 2005 | Rights Issue 2005 | 1 for 3 held | 17,221,907 | 60.00 | 1,033.3 |
| 2017 | Rights Issue 2017 | 1 for 6 held | 31,031,748 | 245.00 | 7,602.8 |
| 2018 | Rights Issue 2018 | 3 for 13 held | 50,128,208 | 250.00 | 12,532.1 |
| 2019 | Rights Issue 2019 | 7 for 23 held | 89,006,863 | 136.00 | 12,104.9 |
EMPLOYEE SHARE OPTION PLANS
| Capitalised Year | Issue | No. of Shares Issued | Price per Share | Contribution to Stated Capital | Reason for Issue |
|---|---|---|---|---|---|
| Rs | Rs Mn | ||||
| 2011 | ESOP 2010 | 524,924 | 80.00 | 42.0 | Benefit for staff members |
| 2012 | ESOP 2010 | 2,200,436 | 80.00 | 176.0 | Benefit for staff members |
| 2013 | ESOP 2010 | 134,933 | 80.00 | 10.8 | Benefit for staff members |
| 2014 | ESOP 2010 | 122,648 | 80.00 | 9.8 | Benefit for staff members |
DISCLOSURE OF RELATED PARTY TRANSACTIONS AS PER SECTION 9.14.7 AND 9.14.8(1), 9.14.8(2) OF THE CSE LISTING RULES
Aggregate values of the transactions carried out by the Bank with the Related Parties did not exceed the following thresholds given in 9.14.8(1), 9.14.8(2) of the CSE Listing Rules.
- Non-recurrent related party transactions - 10% of the equity or 5% of the total assets as at 31st December 2024, whichever is lower.
- Recurrent related party transactions - 10% of the gross revenue/income for the year ended 31st December 2024.
The Related Party Transactions that took place during the year 2024 do not trigger the requirements under Section 9.14.7 of the CSE Listing Rules.
DEBENTURE INFORMATION
(A) Market Values
|
Debentures - 2019/2024 |
Highest (Rs) |
Lowest (Rs) |
Last Traded (Rs) |
|||
|---|---|---|---|---|---|---|
|
2024 |
2023 |
2024 |
2023 |
2024 |
2023 |
|
|
Fixed: 13.90% |
n/t |
100.00 |
n/t |
100.00 |
n/t |
100.00 |
Debentures - 2019/2024 were redeemed on 28th February 2024.
|
Debentures - 2021/2028 |
Highest (Rs) |
Lowest (Rs) |
Last Traded (Rs) |
|||
|---|---|---|---|---|---|---|
|
2024 |
2023 |
2024 |
2023 |
2024 |
2023 |
|
|
Fixed: 9.00% |
n/t |
100.00 |
n/t |
100.00 |
n/t |
100.00 |
|
Debentures - 2023/2028 |
Highest (Rs) |
Lowest (Rs) |
Last Traded (Rs) |
|||
|---|---|---|---|---|---|---|
|
2024 |
2023 |
2024 |
2023 |
2024 |
2023 |
|
|
Fixed: 28.00% |
141.00 |
148.00 |
110.00 |
99.15 |
135.00 |
129.09 |
|
Floating |
n/t |
n/t |
n/t |
n/t |
n/t |
n/t |
n/t - not traded
(B) Interest Rates
|
Debentures - 2019/2024 |
2024 |
2023 |
||
|---|---|---|---|---|
|
Coupon Rate |
Effective Rate |
Coupon Rate |
Effective Rate |
|
|
Fixed: 13.90% |
13.90% |
13.90% |
13.90% |
13.90% |
Debentures - 2019/2024 were redeemed on 28th February 2024.
|
Debentures - 2021/2028 |
2024 |
2023 |
||
|---|---|---|---|---|
|
Coupon Rate |
Effective Rate |
Coupon Rate |
Effective Rate |
|
|
Fixed: 9.00% |
9.00% |
9.00% |
9.00% |
9.00% |
|
Debentures - 2023/2028 |
2024 |
2023 |
||
|---|---|---|---|---|
|
Coupon Rate |
Effective Rate |
Coupon Rate |
Effective Rate |
|
|
Fixed: 28.00% |
28.00% |
28.00% |
28.00% |
28.00% |
|
Floating |
Note 1 |
Note 1 |
||
Note 1
Debentures - 2023/2028
Floating rate is equivalent to the one year gross treasury bill rate plus 1.5%, subject to a floor of 20.0% and a cap of 31.0% p.a. payable annually.
(C) Interest Rates of Comparable Government Securities
|
As at 31st December |
2024 |
2023 |
|---|---|---|
|
3 Month Treasury Bill |
8.62% |
14.51% |
|
6 Month Treasury Bill |
8.77% |
14.16% |
|
5 Year Treasury Bond |
10.64% |
13.75% |
|
7 Year Treasury Bond |
11.05% |
13.45% |
(D) Current Yield and Yield to Maturity
|
Debentures - 2019/2024 |
Fixed: 13.90% |
|
|---|---|---|
|
2024 |
2023 |
|
|
Current yield |
n/t |
13.90% |
|
Yield to maturity of last trade |
n/t |
13.53% |
Debentures - 2019/2024 were redeemed on 28th February 2024.
|
Debentures - 2021/2028 |
Fixed: 9.00% |
|
|---|---|---|
|
2024 |
2023 |
|
|
Current yield |
n/t |
9.00% |
|
Yield to maturity of last trade |
n/t |
8.97% |
|
Debentures - 2023/2028 |
Fixed: 28.00% |
Floating |
||
|---|---|---|---|---|
|
2024 |
2023 |
2024 |
2023 |
|
|
Current yield |
20.74% |
21.69% |
n/t |
n/t |
|
Yield to maturity of last trade |
14.29% |
17.50% |
n/t |
n/t |
n/t - not traded
(E) Ratios - Bank
|
2024 |
2023 |
|
|---|---|---|
|
Debt to equity ratio (%) |
9.6 |
15.6 |
|
Interest cover (Times) |
18.1 |
9.7 |
|
Quick asset ratio (%) |
70.1 |
72.0 |
|
Debt service coverage (Times) |
21.9 |
4.0 |
UTILISATION OF FUNDS RAISED VIA CAPITAL MARKETS
Funds Raised in Previous Years
The funds raised via capital markets in the previous years were fully utilised for the objectives stated in the relevant prospectuses.