Management Discussion And Analysis
 Financial Capital
An astute strategy, robust risk management and an empowered and dedicated team, have enabled us to deliver strong performance, consistently create value for our shareholders and build resilience in the face of considerable uncertainties. With strong liquidity and capital buffers, we are well-positioned for future growth and long-term value creation.
Contributing SDGs


PROFITABILITY IN 2024

Rs 80.0 Bn
10.7%
Net interest income
Rs 11.7 Bn
158.2%
Impairment reversal
Rs 27.3 Bn
59.4%
Profit after tax
ENSURING STABILITY AND BUILDING RESILIENCE IN 2024

Rs 1,777.9 Bn
15.3%
Total assets
Rs 1,469.2 Bn
16.2%
Total deposits
Rs 166.5 Bn
12.6%
Shareholders’ funds
CREATING VALUE FOR SHAREHOLDERS IN 2024

Rs 23.30
59.4%
Earnings per share
17.74%
509 bps
Return on equity
Rs 9.35
59.8%
Dividend per share
Net interest income
Rs 80.0 Bn

Net fee & commission income
Rs 17.5 Bn

Net loss from trading
Rs 1.8 Bn
Net loss on derecognition of financial assets
Rs 7.2 Bn
Net other operating loss
Rs 1.0 Bn
Impairment reversal
Rs 11.7 Bn
Operating expenses
Rs 39.3 Bn
Taxes on financial services
Rs 13.2 Bn
Income tax expense
Rs 19.4 Bn

Profit for the year
Rs 27.3 Bn
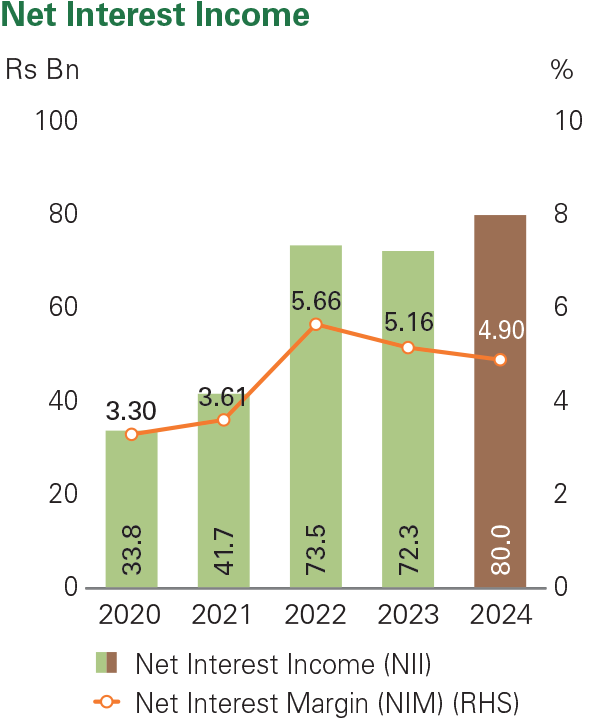
Net Interest Income
Net interest income expanded by 10.7% to Rs 80.0 Bn, as the downward re-pricing of deposits was swifter than loans in a declining interest rate environment. The Dealing/Investment segment also made a significant contribution to net interest income in 2024, as the Bank was compelled to seek alternative investment opportunities for surplus funds amidst subdued credit demand.
Lower yields earned on interest earning assets in a declining interest rate environment led to a contraction in the Bank’s Net Interest Margin (NIM) to 4.90% in 2024 compared with 5.16% in 2023.
Segmental Contribution (Note: The segment assets, liabilities, income, and expenses figures mentioned above include inter-segment balances)
Corporate Banking
2024: 16.9%
2023: 27.2%
SME & Retail Banking
2024: 55.0%
2023: 51.8%
Dealing/Investment
2024: 28.1%
2023: 21.0%
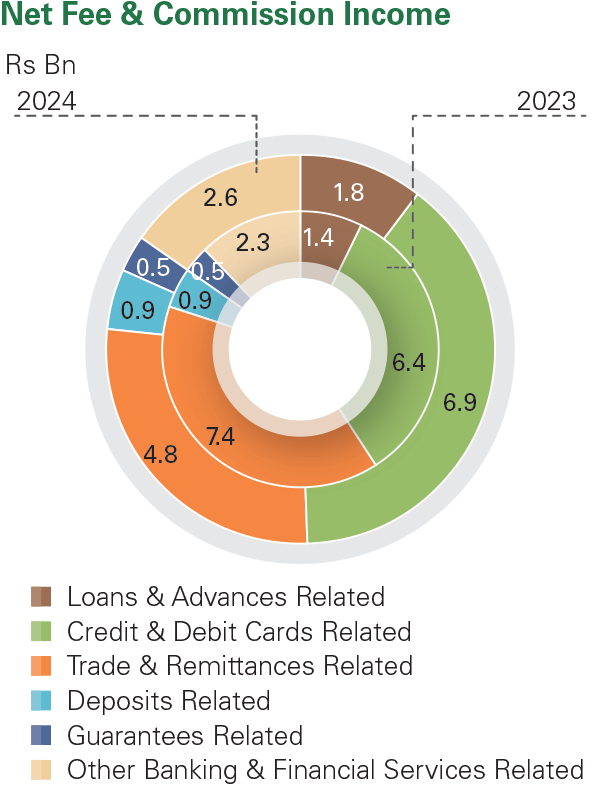
Net Fee and Commission Income
Net fee and commission income contracted by 7.3% to Rs 17.5 Bn in 2024, primarily due to a decline in fee income from trading activities. A reduction in commission rates on trade transactions and the appreciation of the Sri Lankan Rupee against the US Dollar contributed to a 38.8% decline in net fee and commission income from trade related activities to Rs 4.1 Bn in 2024.
However, fees generated from other channels, including credit processing, credit cards, electronic transactions and operational-related activities, remained strong, increasing by 23.5%, 7.3%, 17.4% and 6.9% respectively.
Net Loss on Derecognition of Financial Assets
The Bank reported a loss of Rs 8.4 Bn on restructuring of its Sri Lanka International Sovereign Bond (SLISB) exposure by the GOSL in December 2024.
Under the programme, Sampath Bank exercised the ‘Local Option’ which entailed receiving 30% of its exposure in Sri Lankan Rupee denominated bonds and accepting a 10% nominal haircut on the remainder of its exposure. This resulted in the issuance of new USD denominated bonds representing 63% of its original value with the GOSL retaining the option to settle this bond in local currency in the event of a future default. Additionally, the GOSL also issued a PDI bond with an 11% haircut applied to past-due interest claims and another bond to meet the 1.9% consent fee.
Accordingly, based on the guidelines on “Accounting Treatment for International Sovereign Bonds in Line with SLFRS 9” issued by the Institute of Chartered Accountants of Sri Lanka in December 2024, Sampath Bank recognised a loss of Rs 8.4 Bn on its SLISB exposure following the completion of GOSL’s ISB restructuring programme. The corresponding reversal of impairment provisions amounted to Rs 15.8 Bn is reported under impairment (reversal)/ charge.
Further, the Bank recognised a gain of Rs 1.1 Bn from the sale of Treasury bonds and Treasury bills in 2024, reflecting a 92% growth over 2023.
Net Trading and Other Operating Income
The Bank reported a total loss of Rs 2.8 Bn under net trading and net other operating income in 2024, compared to a loss of Rs 0.8 Bn in 2023. The appreciation of the Sri Lankan Rupee against the US Dollar resulted in an exchange loss of Rs 4.2 Bn in 2024 (2023: Rs 1.9 Bn). This included a net trading loss of Rs 1.8 Bn due to revaluation losses on forward exchange contracts and an exchange loss attributable primarily to the revaluation of FCBU reserve.
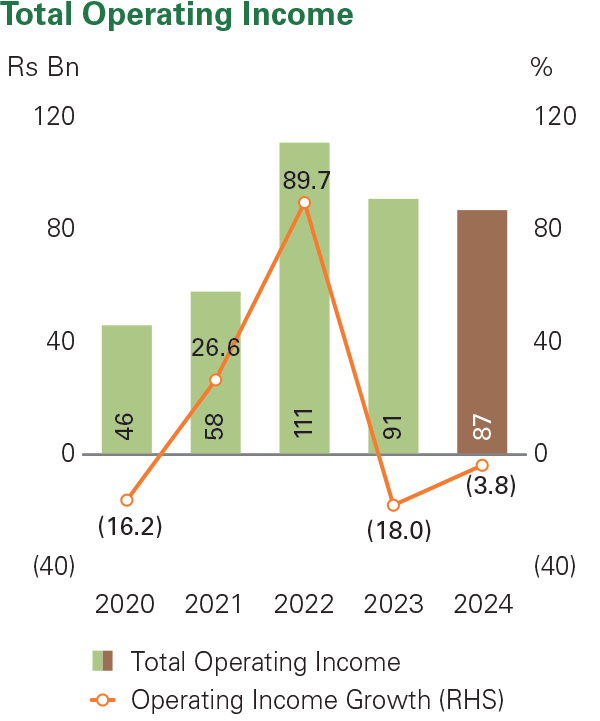
Total Operating Income
Despite the expansion in net interest income, the decline in fee and commission income, the loss recognised due to restructuring of SLISBs and increased exchange losses resulted in a 3.8% decline in operating income to Rs 87.5 Bn in 2024.
Segmental Contribution (Note: The segment assets, liabilities, income, and expenses figures mentioned above include inter-segment balances)
Corporate Banking
2024: 18.9%
2023: 25.8%
SME & Retail Banking
2024: 63.6%
2023: 54.2%
Dealing/Investment
2024: 17.5%
2023: 20.0%
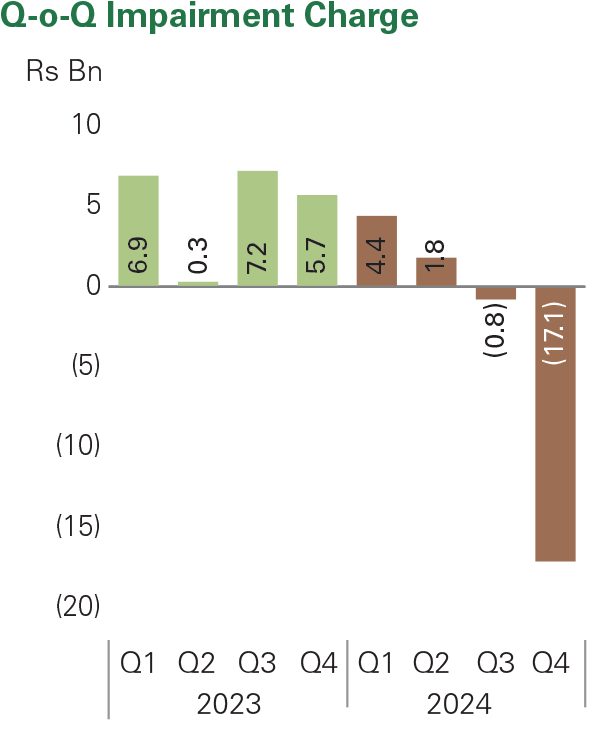
Impairment (Reversal)/Charge
The Bank reported a total impairment reversal of Rs 11.7 Bn for the year 2024, reflecting a significant decrease of 158.2% compared to the previous year. This comprised a charge of Rs 2.8 Bn for loans and advances (2023: Rs 18.1 Bn), a reversal of Rs 15.8 Bn for Sri Lanka International Sovereign Bonds (2023: charge of Rs 5.5 Bn), and a charge of Rs 1.3 Bn for other financial assets and credit related commitments (2023: reversal of Rs 3.5 Bn).
Stabilising macroeconomic conditions, improved repayment capacity of customers and the Bank's prudent provisioning approach in prior years, led to an 84.7% decline in impairment charges for loans and advances to Rs 2.8 Bn in 2024. Additionally, the positive shift in macroeconomic conditions reduced the need for allowance for overlay across most previously stressed segments.
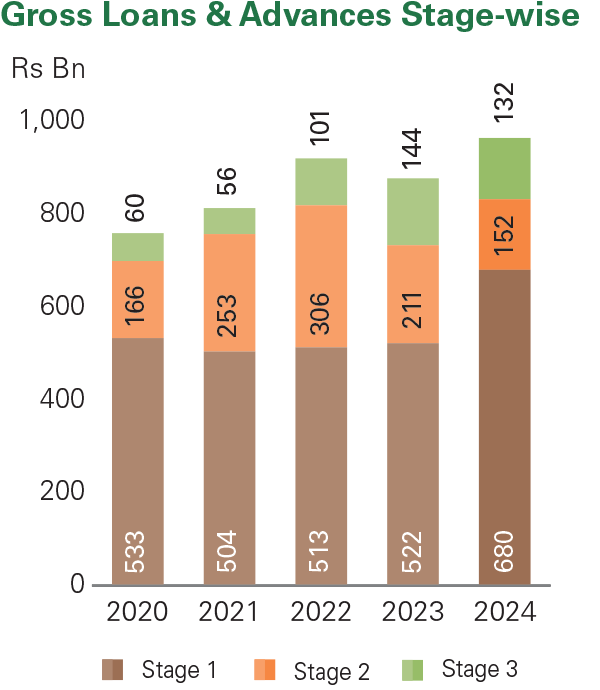
The Bank’s impairment (Stage 3) to Stage 3 loans ratio increased to 60.08% as of end-2024 (2023: 57.80%).
Segmental Contribution (Note: The segment assets, liabilities, income, and expenses figures mentioned above include inter-segment balances)
Corporate Banking
2024: 26.6%
2023: 42.5%
SME & Retail Banking
2024: (0.8)%
2023: 42.5%
Dealing/Investment
2024: (125.8)%
2023: 15.0%

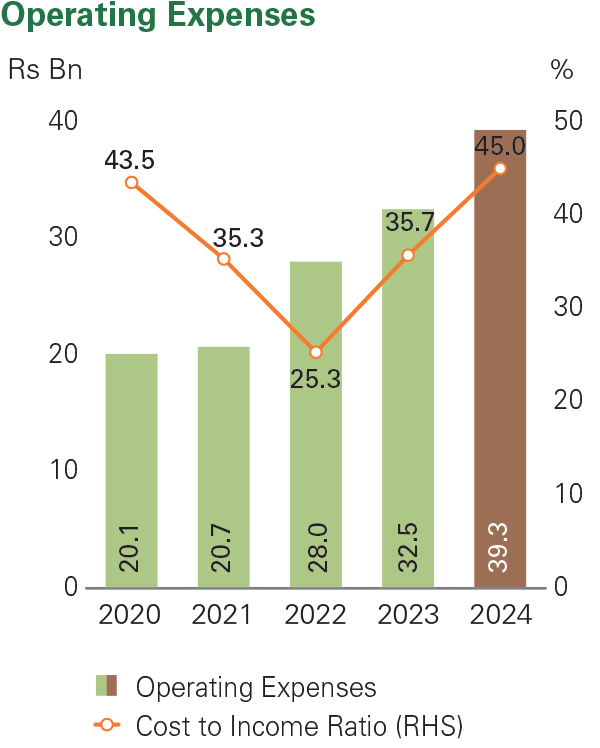
Operating Expenses
Operating expenses rose by 21.2% to Rs 39.3 Bn in 2024. Personnel expenses increased by 26.7% to Rs 18.1 Bn, reflecting annual salary increments for team members, while other expenses expanded by 16.9% to Rs 21.3 Bn.
The Bank’s Cost to Income Ratio (CIR) increased to 45.0% in 2024 from 35.7% in 2023. This rise in CIR was largely attributed to an increase in operating expenses, while total operating income declined by 3.8% during the year.
Segmental Contribution (Note: The segment assets, liabilities, income, and expenses figures mentioned above include inter-segment balances)
Corporate Banking
2024: 4.0%
2023: 4.2%
SME & Retail Banking
2024: 94.0%
2023: 94.3%
Dealing/Investment
2024: 2.0%
2023: 1.5%
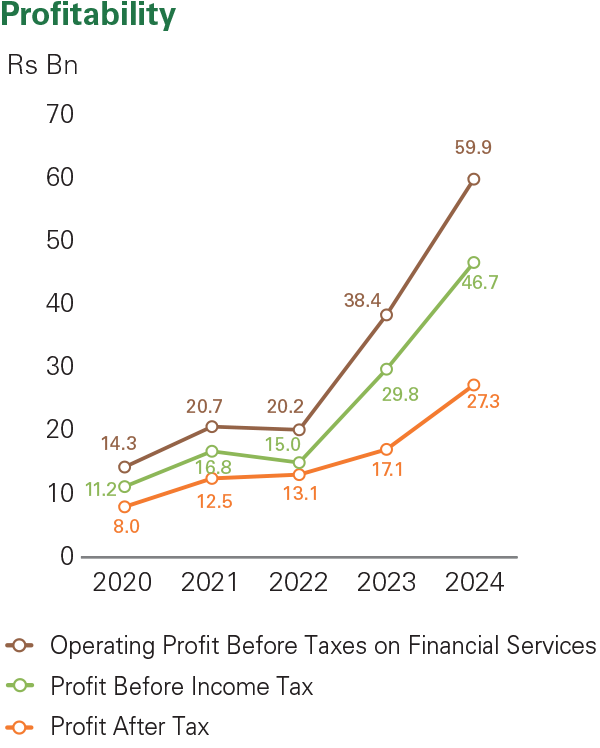
Profitability
Underpinned by increased net interest income and the impairment reversal, operating profit before taxes on financial services expanded by 56.1% to Rs 59.9 Bn.
Total taxes on financial services and income tax increased by 53.0% and 53.7% respectively, resulting in a total tax expense of Rs 32.6 Bn in 2024. Accordingly, profit before tax rose by 57.0% to Rs 46.7 Bn (2023: Rs 29.8 Bn), while profit after tax increased by 59.4% to Rs 27.3 Bn in 2024 (2023: Rs 17.1 Bn).
Segmental Contribution (Note: The segment assets, liabilities, income, and expenses figures mentioned above include inter-segment balances)
Corporate Banking
2024: 16.4%
2023: 26.5%
SME & Retail Banking
2024: 49.1%
2023: 49.4%
Dealing/Investment
2024: 34.5%
2023: 24.1%
Approach to Taxation
The Board of Directors formulates and implements the Bank’s tax strategy while compliance with all tax regulations is monitored on an ongoing basis by the Bank’s tax consultant and the external auditors. The Bank and all its subsidiaries liaise regularly with tax authorities to ensure the timely filing of tax returns and payment of all tax obligations. The Bank fully complied with all tax-related regulations during the year under review.
In 2024, Sampath Bank’s tax on financial services increased by 53.0% to Rs 13.2 Bn, while income tax rose by 53.7% to Rs 19.4 Bn, reflecting improved performance. Taxes paid to the Government of Sri Lanka in 2024 amounted to Rs 33.8 Bn, compared to Rs 32.8 Bn in 2023.
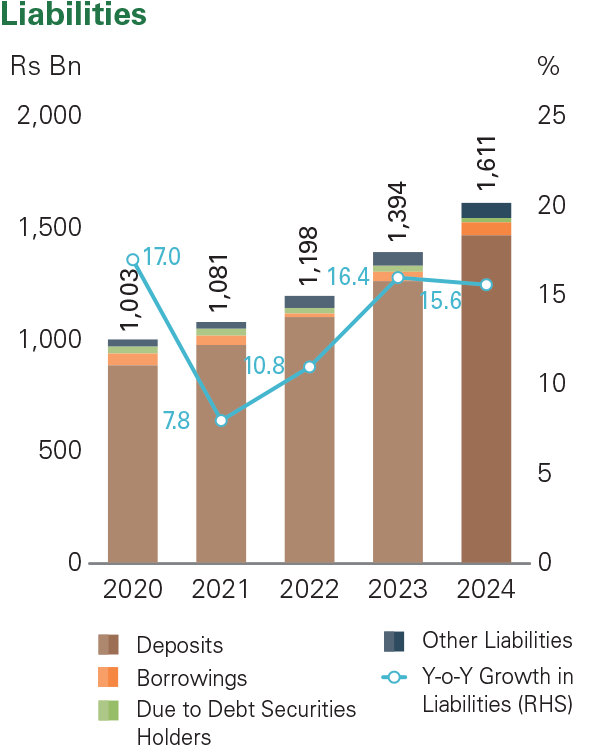
Liabilities
Rs 1,611.4 Bn
Shareholders’ funds
Rs 166.5 Bn
Assets
Rs 1,777.9 Bn
Assets
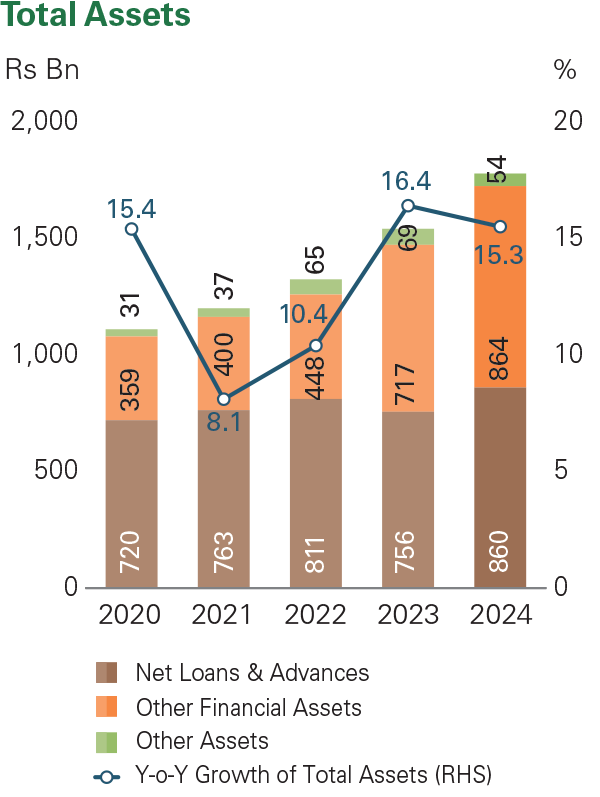
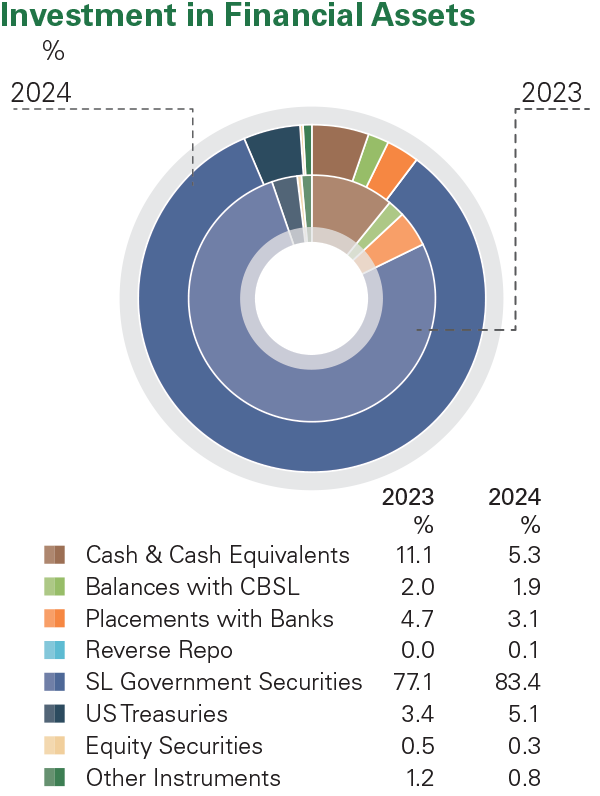
Sampath Bank’s total assets expanded by 15.3% to Rs 1.78 Tn as at end- December 2024. The Bank’s liquidity position strengthened, with investments in financial assets expanding by 28.7% to Rs 801 Bn as at end-December 2024 as alternative investments were sought for surplus funds amidst subdued credit demand. Investments in financial assets comprised primarily investments in LKR Government Securities, which accounted for 88% of total investments in financial assets as of end of 2024. Additionally, investments in US Treasuries recorded a notable increase of 80.5% to Rs 43.7 Bn as at end-December 2024.
Meanwhile, the Bank’s gross loans and advances expanded by 9.9% to Rs 964.6 Bn as at end-2024. Sri Lanka Rupee-denominated gross loans and advances grew by 11.2% to Rs 822.8 Bn, driven primarily by import loans and money market facilities. The Bank’s foreign currency-denominated lending portfolio increased by 3.4% to Rs 141.8 Bn, despite the appreciation of the Sri Lankan Rupee against the US Dollar.
Improving macroeconomic conditions, focused recovery efforts and a data- driven approach to strengthening the credit risk management process resulted in the Bank’s Impaired Loans (Stage 3) ratio improving to 4.69% as of the end of 2024 (2023: 5.87%). Please refer the Risk Report for more details on how Sampath Bank managed its credit risk in 2024.
Overall, increased investment in Government Securities led to the Bank’s asset composition shifting further towards financial investments as at end- 2024. Accordingly, the proportion of financial investments increased to 45% as at end-2024 (end-2023: 40%), while the proportion of loans and advances stood at 48% compared to 49% as at end-2023.
Segmental Contribution (Note: The segment assets, liabilities, income, and expenses figures mentioned above include inter-segment balances)
Corporate Banking
2024: 15.9%
2023: 16.8%
SME & Retail Banking
2024: 55.4%
2023: 56.3%
Dealing/Investment
2024: 28.7%
2023: 26.9%
Liabilities
Total liabilities expanded by 15.6% to Rs 1,611 Bn as at end- 2024, with deposits accounting for 91% of total liabilities.
Strong deposit growth led to the Bank’s deposit base expanding by 16.2% to Rs 1,469.2 Bn as at end- 2024. Growth was driven primarily by local currency deposits, which increased by 20.2% to Rs 1,247.3 Bn, and offset a 2.1% contraction in foreign currency- denominated deposits to Rs 222.0 Bn due to the appreciation of the Sri Lankan Rupee against the US Dollar.
Concerted efforts to strengthen the Bank’s CASA position proved favourable, as the CASA base expanded by 18.3% to Rs 499.4 Bn, compared to a 15.2% growth in the Fixed Deposit base to Rs 962.3 Bn as at end-2024.
Amounts due to debt securities holders declined by 29.3% to Rs 18.9 Bn as at end-2024 due to the redemption of debentures that matured in February 2024.
Shareholders’ Funds
The Bank’s capital position remained strong as at end-2024. Shareholders’ funds increased by 12.6% to Rs 166.5 Bn, supported by strong performance.
The Bank’s capital adequacy ratios remained well above the regulatory minimum requirement.
| 2024 | 2023 | |
|---|---|---|
| Common equity Tier I capital ratio | 16.75% | 16.35% |
| Tier I capital ratio | 16.75% | 16.35% |
| Total capital ratio | 19.38% | 19.56% |
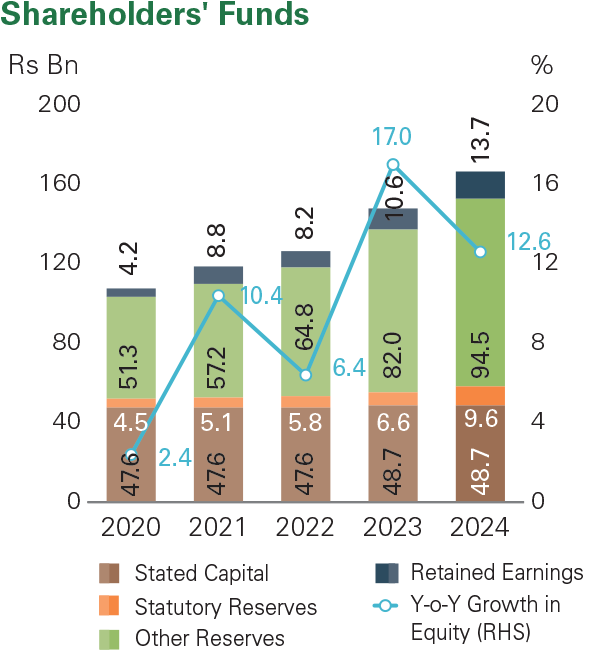
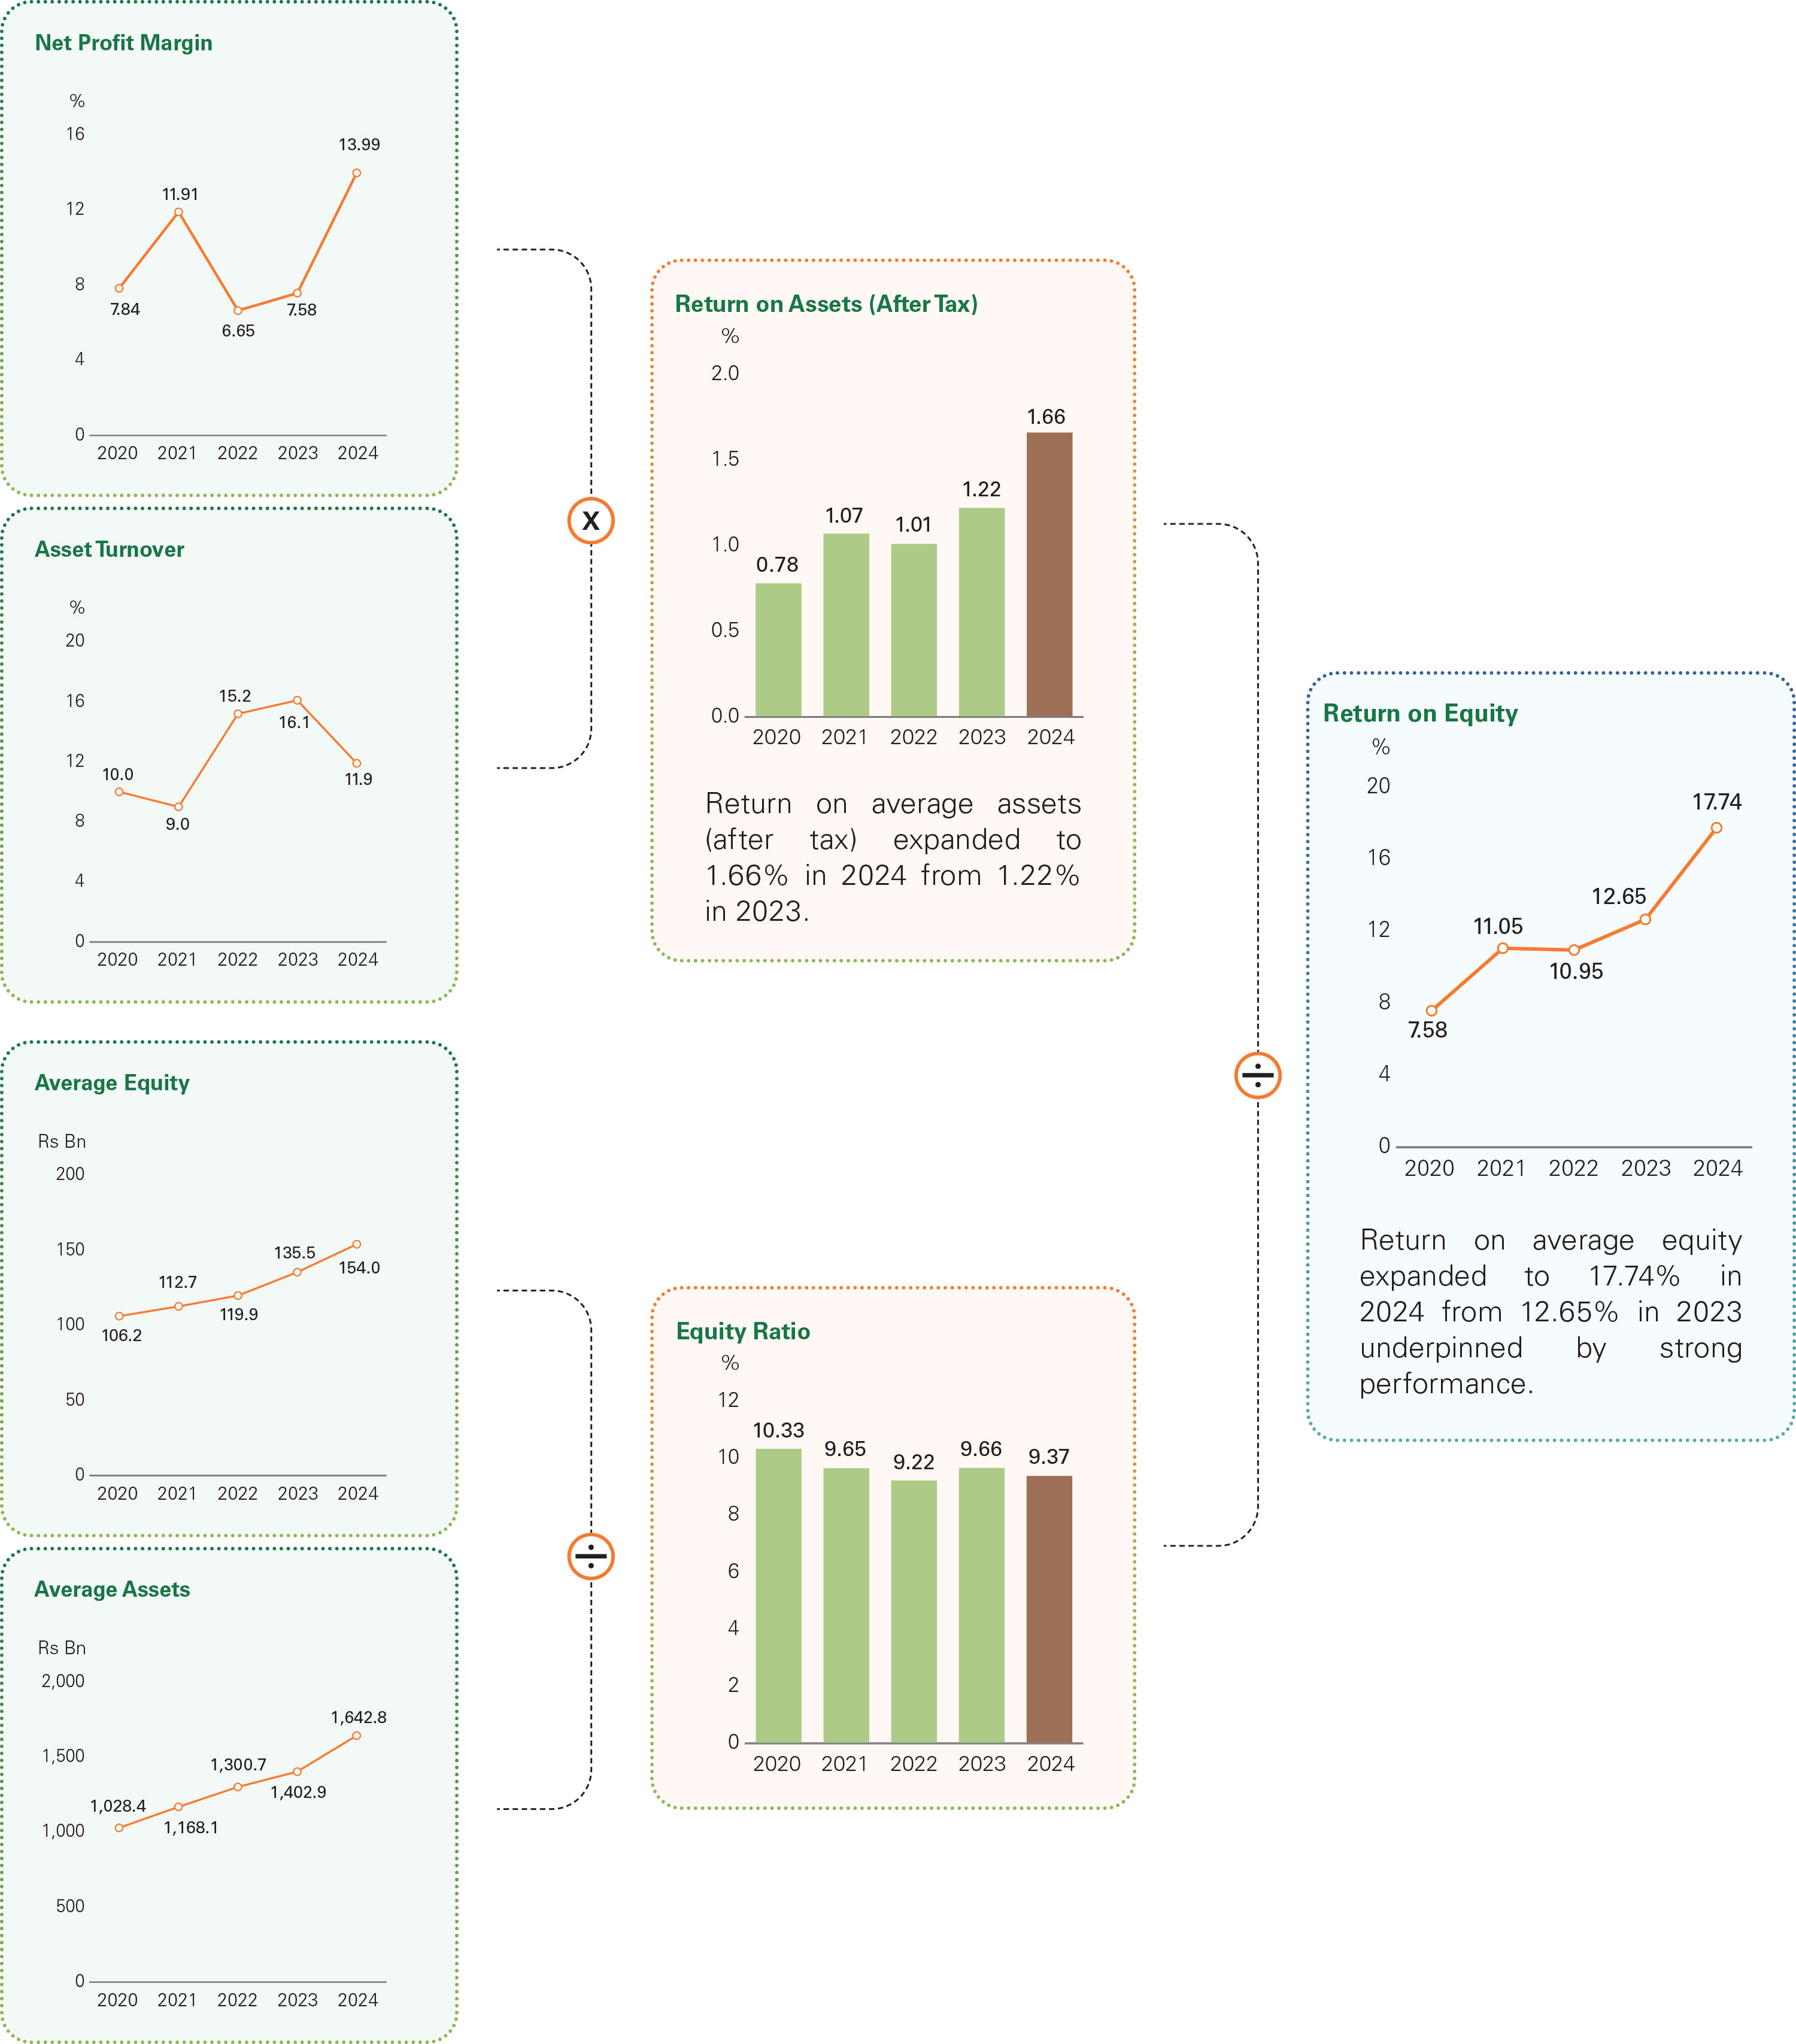
Strong performance drove superior shareholder value creation, as the Bank’s Earnings per Share increased by 59.4% to Rs 23.30 in 2024, while Return on Average Equity rose to 17.7% in 2024 (2023: 12.7%). The Board recommended a final cash dividend of Rs 9.35 per share, bringing the dividend payout ratio to 40.13% (2023: 40.02%).
The value created for shareholders in 2024 is highlighted below through an analysis of the key drivers of the Bank’s Return on Average Equity.
Vertical Analysis of the Statement of Profit or Loss
| For the year ended | 2024 | 2023 | 2022 | 2021 | ||||
|---|---|---|---|---|---|---|---|---|
| Rs Mn | % | Rs Mn | % | Rs Mn | % | Rs Mn | % | |
| Gross income | 195,321 | 100 | 226,154 | 100 | 197,571 | 100 | 104,570 | 100 |
| Interest income | 183,055 | 94 | 203,447 | 90 | 157,619 | 80 | 85,987 | 82 |
| Less: Interest expenses | 103,047 | 53 | 131,157 | 58 | 84,117 | 43 | 44,318 | 42 |
| Net interest income | 80,008 | 41 | 72,290 | 32 | 73,502 | 37 | 41,669 | 40 |
| Exchange income | (4,220) | (2) | (1,887) | (1) | 16,261 | 8 | 4,849 | 5 |
| Other income | 11,706 | 6 | 20,570 | 9 | 21,191 | 11 | 11,969 | 11 |
| Total operating income | 87,494 | 45 | 90,973 | 40 | 110,954 | 56 | 58,487 | 56 |
| Less: Impairment charge | (11,728) | (6) | 20,149 | 9 | 62,706 | 32 | 17,085 | 16 |
| Operating expenses | 39,333 | 20 | 32,457 | 14 | 28,048 | 14 | 20,668 | 20 |
| Profit before all taxes | 59,889 | 31 | 38,367 | 17 | 20,200 | 10 | 20,734 | 20 |
| Less: Taxes | 32,568 | 17 | 21,227 | 9 | 7,066 | 4 | 8,277 | 8 |
| Profit for the year | 27,321 | 14 | 17,140 | 8 | 13,134 | 7 | 12,457 | 12 |
Horizontal Analysis of the Statement of Profit or Loss
| For the year ended | 2024 | 2023 | 2022 | 2021 | ||||
|---|---|---|---|---|---|---|---|---|
| Rs Mn | % | Rs Mn | % | Rs Mn | % | Rs Mn | % | |
| Gross income | 195,321 | (14) | 226,154 | 14 | 197,571 | 89 | 104,570 | 2 |
| Interest income | 183,055 | (10) | 203,447 | 29 | 157,619 | 83 | 85,987 | (3) |
| Less: Interest expenses | 103,047 | (21) | 131,157 | 56 | 84,117 | 90 | 44,318 | (19) |
| Net interest income | 80,008 | 11 | 72,290 | (2) | 73,502 | 76 | 41,669 | 23 |
| Exchange income | (4,220) | (124) | (1,887) | (112) | 16,261 | 235 | 4,849 | 74 |
| Other income | 11,706 | (43) | 20,570 | (3) | 21,191 | 77 | 11,969 | 25 |
| Total operating income | 87,494 | (4) | 90,973 | (18) | 110,954 | 90 | 58,487 | 27 |
| Less: Impairment charge | (11,728) | (158) | 20,149 | (68) | 62,706 | 267 | 17,085 | 45 |
| Operating expenses | 39,333 | 21 | 32,457 | 16 | 28,048 | 36 | 20,668 | 3 |
| Profit before all taxes | 59,889 | 56 | 38,367 | 90 | 20,200 | (3) | 20,734 | 45 |
| Less: Taxes | 32,568 | 53 | 21,227 | 200 | 7,066 | (15) | 8,277 | 31 |
| Profit for the year | 27,321 | 59 | 17,140 | 31 | 13,134 | 5 | 12,457 | 55 |
Vertical Analysis of the Statement of Financial Position
| As at 31st December | 2024 | 2023 | 2022 | 2021 | ||||
|---|---|---|---|---|---|---|---|---|
| Rs Mn | % | Rs Mn | % | Rs Mn | % | Rs Mn | % | |
| Assets | ||||||||
| Cash and cash equivalents including placements | 72,682 | 4 | 113,013 | 7 | 90,090 | 7 | 25,623 | 2 |
| Net loans and advances | 860,152 | 48 | 756,436 | 49 | 811,158 | 61 | 762,588 | 64 |
| Other interest earning assets | 772,150 | 43 | 584,889 | 38 | 321,531 | 24 | 338,871 | 28 |
| Investment in subsidiaries | 4,191 | - | 4,111 | - | 3,899 | - | 3,503 | - |
| Property, plant and equipment | 10,855 | 1 | 9,623 | 1 | 8,911 | 1 | 7,818 | 1 |
| Other assets | 57,911 | 3 | 73,876 | 5 | 88,837 | 7 | 61,510 | 5 |
| Total assets | 1,777,941 | 100 | 1,541,948 | 100 | 1,324,426 | 100 | 1,199,913 | 100 |
| Liabilities | ||||||||
| Deposits from banks and customers | 1,469,222 | 82 | 1,264,470 | 82 | 1,103,213 | 83 | 978,368 | 82 |
| Debt securities holders, borrowings from banks & repo | 77,168 | 4 | 68,829 | 4 | 40,901 | 3 | 72,829 | 6 |
| Other liabilities | 65,013 | 4 | 60,776 | 4 | 53,932 | 4 | 29,964 | 2 |
| Total liabilities | 1,611,403 | 90 | 1,394,075 | 90 | 1,198,046 | 90 | 1,081,161 | 90 |
| Equity | ||||||||
| Stated capital | 48,741 | 3 | 48,741 | 3 | 47,622 | 4 | 47,622 | 4 |
| Reserves | 117,797 | 7 | 99,132 | 7 | 78,758 | 6 | 71,130 | 6 |
| Total equity | 166,538 | 10 | 147,873 | 10 | 126,380 | 10 | 118,752 | 10 |
| Total liabilities and equity | 1,777,941 | 100 | 1,541,948 | 100 | 1,324,426 | 100 | 1,199,913 | 100 |
Horizontal Analysis of the Statement of Financial Position
| As at 31st December | 2024 | 2023 | 2022 | 2021 | ||||
|---|---|---|---|---|---|---|---|---|
| Rs Mn | % | Rs Mn | % | Rs Mn | % | Rs Mn | % | |
| Assets | ||||||||
| Cash and cash equivalents including placements | 72,682 | (36) | 113,013 | 25 | 90,090 | 252 | 25,623 | (21) |
| Net loans and advances | 860,152 | 14 | 756,436 | (7) | 811,158 | 6 | 762,588 | 6 |
| Other interest earning assets | 772,150 | 32 | 584,889 | 82 | 321,531 | (5) | 338,871 | 10 |
| Investment in subsidiaries | 4,191 | 2 | 4,111 | 5 | 3,899 | 11 | 3,503 | 5 |
| Property, plant and equipment | 10,855 | 13 | 9,623 | 8 | 8,911 | 14 | 7,818 | (4) |
| Other assets | 57,911 | (22) | 73,876 | (17) | 88,837 | 44 | 61,510 | 67 |
| Total assets | 1,777,941 | 15 | 1,541,948 | 16 | 1,324,426 | 10 | 1,199,913 | 8 |
| Liabilities | ||||||||
| Deposits from banks and customers | 1,469,222 | 16 | 1,264,470 | 15 | 1,103,213 | 13 | 978,368 | 10 |
| Debt securities holders, borrowings from banks & repo | 77,168 | 12 | 68,829 | 68 | 40,901 | (44) | 72,829 | (13) |
| Other liabilities | 65,013 | 7 | 60,776 | 13 | 53,932 | 80 | 29,964 | (7) |
| Total liabilities | 1,611,403 | 16 | 1,394,075 | 16 | 1,198,046 | 11 | 1,081,161 | 8 |
| Equity | ||||||||
| Stated capital | 48,741 | - | 48,741 | 2 | 47,622 | - | 47,622 | - |
| Reserves | 117,797 | 19 | 99,132 | 26 | 78,758 | 11 | 71,130 | 19 |
| Total equity | 166,538 | 13 | 147,873 | 17 | 126,380 | 6 | 118,752 | 10 |
| Total liabilities and equity | 1,777,941 | 15 | 1,541,948 | 16 | 1,324,426 | 10 | 1,199,913 | 8 |

Stabilising macroeconomic conditions, improved repayment capacity of customers and the Bank's prudent provisioning approach in prior years, led to an 84.7% decline in impairment charges for loans and advances to Rs 2.8 Bn in 2024.

OUTLOOK
As macro-economic conditions and investor sentiment continue to improve, the Bank intends on utilising advanced analytics to monitor developments and implement strategies to effectively capture emerging opportunities for diversification. Moreover, the Bank plans to utilise more efficient asset and liability management techniques for effective margin management in a low interest rate environment. Optimising provisions and strengthening recoveries by supporting business revival and leveraging data analytics will also be a key area of focus. The Bank will also continue to evolve its processes to fulfil the reporting requirements of SLFRS Sustainability Standards S1 and S2 in the year ahead.